
How Can GPS‑Based Scavenger Hunts Boost Corporate Event Engagement?
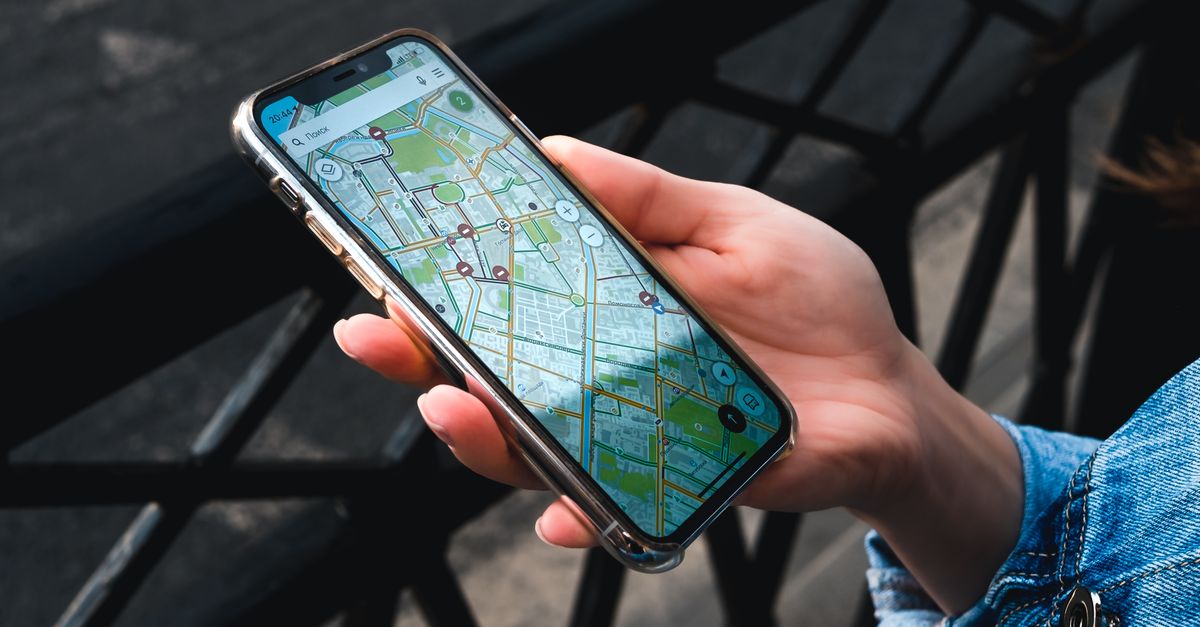
The rise of experiential marketing has shifted corporate event design from passive presentations to interactive challenges. Among the most effective tools is the GPS‑based scavenger hunt, which blends technology, teamwork and real‑world exploration. In this article I outline why these hunts work, how to tailor them for your organization, and what practical steps you need to take to maximize engagement and return on investment.
Why Corporate Event Games Matter
Corporate events traditionally rely on keynote speakers and slide decks. While informative, such formats often fail to keep participants mentally alert or emotionally invested. Interactive games create shared goals, foster collaboration, and provide measurable behavioral data—all of which translate into stronger team cohesion and higher post‑event satisfaction.
Key Benefits
- Immediate engagement: Participants are active rather than passive listeners.
- Data capture: GPS tracking and time stamps provide quantitative insights.
- Brand immersion: Custom themes embed corporate messaging into gameplay.
- Scalability: Game mechanics can be replicated across multiple locations or events.
- Long‑term retention: Active participation reinforces learning and brand recall more effectively than passive consumption.
Because engagement is quantifiable, organizers can set clear success metrics—such as average points per team or the proportion of participants who complete all checkpoints—and adjust the game’s difficulty in real time to maintain a healthy balance between challenge and enjoyment.
What Is a GPS‑Based Scavenger Hunt?
A GPS‑based scavenger hunt assigns participants teams that navigate to pre‑designated coordinates using smartphones or dedicated devices. Each location holds a clue, task or digital asset that the team must complete before proceeding. The system records arrival times and completion status in real time.
Core Components
- Map interface: Users see waypoints and receive turn‑by‑turn directions.
- Clue engine: Text, images or QR codes unlock the next step.
- Scoring logic: Points awarded for speed, accuracy or creativity.
- Leaderboard: Live ranking keeps competition alive.
- AR integration (optional): Augmented reality overlays can provide visual hints or reveal hidden clues when viewed through the device camera.
Typical Workflow
The event organizer uploads waypoints and clues to a cloud platform. Teams receive unique credentials that lock the game to their device. As they progress, the system updates the leaderboard and triggers notifications for upcoming challenges. At the end, analytics dashboards summarize performance metrics.
In practice, the workflow often begins with a concept session where stakeholders define objectives and themes. Following this, developers or vendors configure the platform, integrate brand assets, and test the GPS accuracy in the event venue. On the day of the event, a support team monitors real‑time data to address any technical hiccups and keeps participants motivated through live chat or on‑site ambassadors.
Gamified Journey Design
Beyond simple waypoint navigation, a compelling scavenger hunt weaves narrative beats into each checkpoint. Teams might start with a “mission brief” that establishes stakes, then progress to challenges that build upon previous discoveries—much like levels in an adventure game. This layered structure sustains curiosity and encourages teams to strategize about which clues to tackle first.
Experiential Marketing Hunts: Why They Work
Experiential marketing turns abstract brand concepts into tangible actions. In a scavenger hunt, participants physically interact with branded assets—logos on signage, product samples at checkpoints, or augmented reality overlays that reveal corporate stories.
Integrating Brand Narrative
- Story arcs: Each waypoint represents a chapter of your brand’s journey.
- Interactive touchpoints: Users solve puzzles related to product features.
- Social media triggers: QR codes link to branded hashtags or shareable content.
For example, a technology firm might design checkpoints that simulate the evolution of its flagship product—from concept sketches to final prototype—allowing participants to "unlock" each phase by solving a technical riddle. This narrative approach not only entertains but also educates attendees about the company’s innovation roadmap.
Measuring Impact
Because each interaction is logged, you can track how many participants engaged with specific brand elements. Heatmaps of GPS data reveal hotspots where participants congregated, while time‑spent analytics show which clues held them longest. This granular insight feeds into post‑event surveys and helps refine future campaigns.
Customizable Hunt Themes: Tailoring to Your Audience
A theme determines the game's aesthetic and narrative. Customization ranges from simple color palettes to complex storylines that align with corporate objectives.
Theme Design Checklist
- Audience alignment: Match tone (serious, playful, futuristic) to participant demographics.
- Visual consistency: Use brand colors and typography across all assets.
- Gamification depth: Decide on difficulty levels, bonus challenges or “Easter eggs.”
- Accessibility: Ensure clues are solvable by people with varying skill sets.
- Cultural sensitivity: Avoid idioms or symbols that could be misinterpreted in international settings.
- Localization: Translate clue text and audio cues into local languages when hosting global events.
Implementation Steps
1. Draft a storyboard that maps each waypoint to a brand message.
2. Design visual assets (logos, icons, backgrounds).
3. Encode clues into the platform’s clue engine.
4. Pilot the theme with a small group before full rollout.
5. Gather pilot feedback on clarity, difficulty and engagement, then iterate.
Designing the Clues: From Simple to Complex
- Text riddles: Short puzzles that require basic reasoning.
- Puzzle boxes: Physical or virtual containers holding a key to the next clue.
- Multimedia challenges: Audio clues, short videos, or AR overlays that add sensory depth.
Ensuring Accessibility and Inclusivity
Inclusive design extends beyond language. Consider offering alternative navigation methods for participants with visual impairments—such as audio prompts or haptic vibration cues. Provide clear signage at checkpoints, use high‑contrast colors, and allow teams to customize the pace of play by adjusting time limits per clue.
Treasure Hunt Event Solutions: The Technical Stack
Building a reliable GPS‑based hunt requires careful selection of hardware and software components. Below is an overview of common solutions and their trade‑offs.
Hardware Options
- Smartphones: Cost‑effective, high user familiarity; limited battery life.
- Dedicated GPS trackers: Longer battery, but higher upfront cost.
- Wearables: Can provide haptic feedback but require app integration.
- NFC tags: Embedded at checkpoints to trigger actions without manual scanning.
Software Platforms
- Custom in‑house development: Full control, higher initial effort.
- Third‑party SaaS (e.g., Scavenger Hunt Pro): Rapid deployment, standard features.
- Hybrid approach: Use open‑source mapping libraries with proprietary branding modules.
Security & Privacy Considerations
Always encrypt location data and obtain explicit participant consent. Store logs on secure cloud infrastructure compliant with GDPR or CCPA as applicable. Implement role‑based access controls so that only authorized staff can view sensitive data, and ensure a clear data retention policy is communicated to participants.
Planning and Execution Checklist
Successful hunts require meticulous pre‑planning, clear communication, and post‑event follow‑up.
- Define objectives: Engagement metrics, brand recall, team building goals.
- Create a timeline: From asset creation to event day operations.
- Test the system: Run a dry run with volunteers to catch glitches.
- Train staff: Ensure support teams understand scoring rules and troubleshooting.
- Gather feedback: Use in‑game surveys and post‑event interviews.
Common Mistakes to Avoid
- Overloading participants with too many checkpoints.
- Ignoring battery life constraints on mobile devices.
- Neglecting accessibility for team members with disabilities.
- Failing to provide clear instructions at the start.
- Lacking a backup plan for GPS outages or signal loss.
- Underestimating the need for on‑site signage and directional aids.
Measuring Return on Investment (ROI)
Quantifying ROI involves linking game outcomes to business KPIs. Key metrics include:
- Participation rate: % of invited attendees who joined the hunt.
- Engagement duration: Average time spent per checkpoint.
- Brand recall score: Post‑event survey responses tied to game themes.
- Lead conversion: Number of qualified contacts generated during or after the event.
Combine these with cost data—platform fees, asset production, staff hours—to calculate a net benefit figure. For example, if your event cost $15,000 and you captured 300 qualified leads that later became revenue of $120,000 over six months, the ROI would be 800%. Presenting this in executive dashboards helps secure budget for future events.
Personal Experience: A Pilot Launch at a Fortune 500 Conference
In my experience, rolling out a GPS‑based hunt to 200+ participants over two days required a dedicated on‑site technical team. The first day’s pilot revealed that the default map zoom level caused confusion; adjusting it reduced navigation errors by 35%.Participants reported higher energy levels throughout the conference, and post‑event surveys showed a 22% increase in brand recall compared to previous years’ passive sessions. Additionally, real‑time leaderboard updates kept teams motivated, while the live chat feature resolved device issues within minutes—preventing potential drop‑offs.
Key takeaway: The real value of GPS‑based scavenger hunts lies not just in fun, but in their ability to capture actionable data that aligns directly with corporate objectives.Case Study: Global Retail Chain Implementation
A multinational retailer deployed a city‑wide hunt across three metropolitan locations. By integrating local cultural references into the clues and offering multilingual support, they achieved an 18% higher completion rate than in previous single‑city events. Post‑event analytics showed that participants spent on average 12 minutes per checkpoint, allowing the marketing team to identify which product categories resonated most with consumers.
How do you measure engagement for your next experiential marketing event?


